Some user had the bright idea to try to draw graphs in style of hand drawn sketches. See the following page for examples.
There are now implementations in various languages. I had some fun programming this in Euler. You need to load the package.
>load xkcd.e
There is some start code, which sets the "Humor Sans" font, which you need to install. You can find that in the net.
>r=1.2; handstart(-r,r,-r,r);
Now that we started, we can draw a graph in that style.
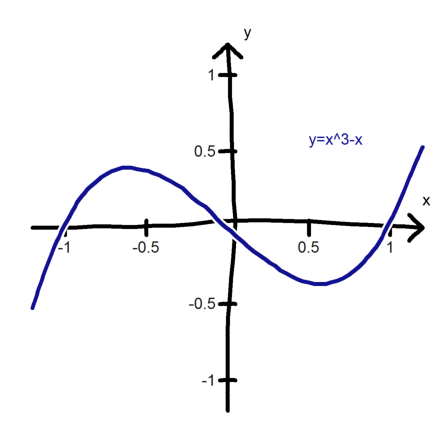
>clg; hold on; axesh(); ...
 handlabel("x",r,0.1,color=black); ...
 handlabel("y",0.1,r,color=black); ...
 xtickh([1,0.5,-0.5,-1]); ytickh([-0.5,0.5,1,-1]); ...
 handcurve("x","x^3-x",-r,r,>white,color=blue,n=100); ...
 handlabel("y=x^3-x",0.5,0.5,color=blue);
To stop, do not forget to turn holding off.
>hold off; insimg;
Here is an another example.
>r=1.7; handstart(-0.1,r,-0.1,r);
This time, I define a function.
>function drawall ...
 global r;
 clg; hold on;
 handarrow(0,-0.1,0,r); handarrow(-0.1,0,r,0);
 handcurve("cos(x)","sin(x)",-0.05,pi/2+0.05,>white);
 x=0.45*pi/2; handplot([0,cos(x)],[0,sin(x)]);
 handplot([cos(x),cos(x)],[0,sin(x)],color=blue);
 handplot([0,cos(x)],[sin(x),sin(x)],color=red);
 handplot([cos(x),sec(x)],[sin(x),0],color=blue);
 handplot([cos(x),0],[sin(x),cosec(x)],color=red);
 handplot([0,sec(x)],[-0.05,-0.05],color=blue);
 handplot([-0.05,-0.05],[0,cosec(x)],color=red);
 handlabel("cos",cos(x)/2,sin(x),color=red);
 handlabel("cot",cos(x)/2,(cosec(x)+sin(x))/2,color=red);
 handspline([-0.05,0.2,0.4],[0.8,1.3,1.4],width=1,color=red);
 handlabel("cosec",0.4,1.4,color=red);
 handlabel("sin",cos(x)*0.8,sin(x)/2,color=blue);
 handlabel("tan",(sec(x)+cos(x))/2,sin(x)/2,color=blue);
 handspline([0.8,1.2,1.4],[-0.05,0.3,0.4],width=1,color=blue);
 handlabel("sec",1.4,0.4,color=blue);
 handbox(0.9,0.9,r,1.15,width=2);
 handlabel("Classical",0.95,1.0);
 handlabel("Trigonometry",0.95,0.9);
 handcurve("0.2*cos(x)","0.2*sin(x)",0,x);
 handplot([0.2,0.2],[0.05,0.4],width=1);
 handlabel("Angle",0.2,0.4,color=black);
 hold off;
 endfunction
>drawall(); hold off; insimg;
